
Ready by 11:01pm Sep 11, 2026
Ratio Analysis Explained: A Student Guide With Worked Examples
Ratio analysis turns a set of financial statements into a story about a company’s performance. You calculate ratios across profitability, liquidity, efficiency, then gearing, compare them to prior years or competitors, then explain what they reveal. The marks sit in the interpretation, not the calculation.
A common mistake is treating ratio analysis as a calculation exercise. Working out a current ratio is easy; explaining what it says about the company, then why it changed, is the actual assignment. This guide covers the main ratio categories with worked examples, then shows how to turn the numbers into the interpretation that earns marks.
What is ratio analysis?
Ratio analysis is the practice of relating one figure from the financial statements to another to reveal something about performance or position. A single number, revenue of two million pounds, tells you little. Related to something else, revenue against capital employed, or profit against sales, it becomes meaningful. Ratios let you compare companies of different sizes, then track one company over time.
What are the main categories of ratios?
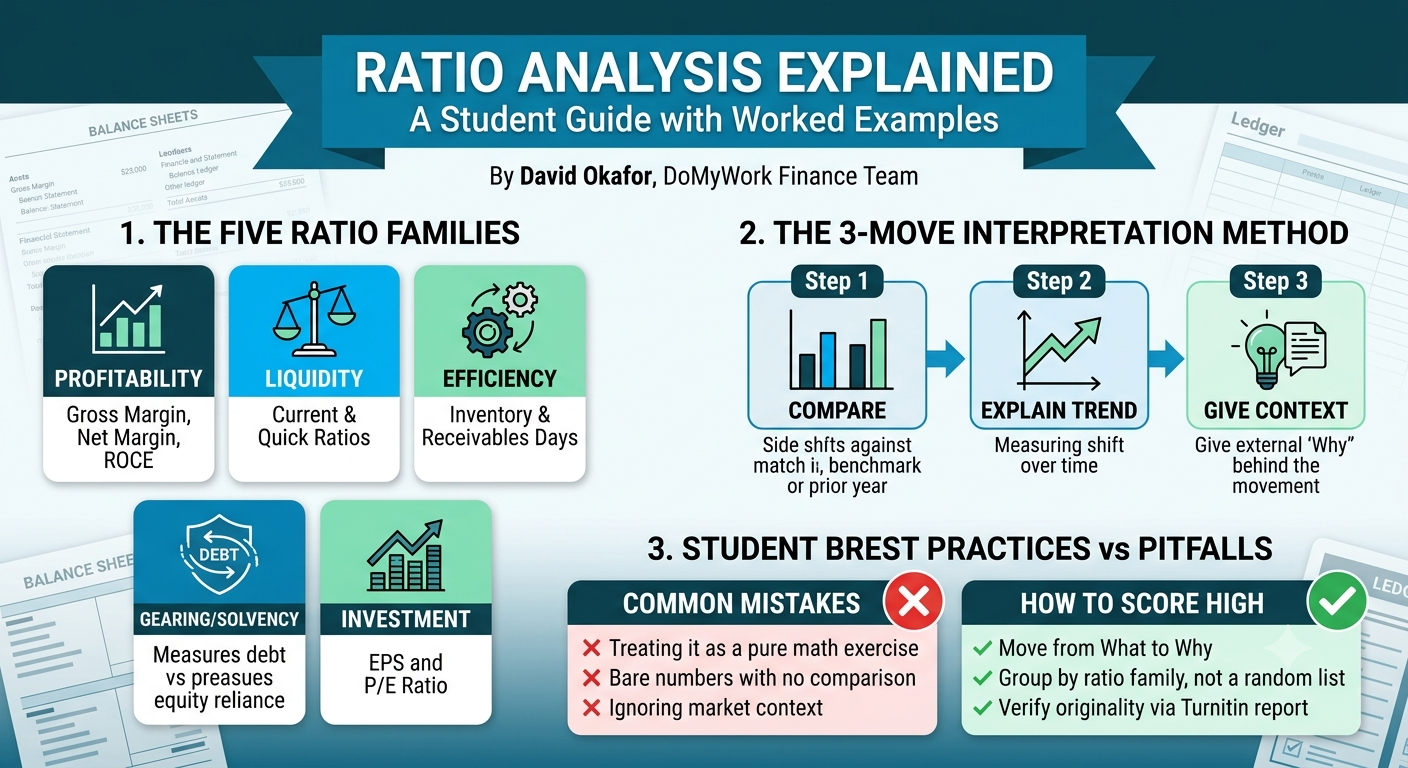
Ratios group into a few families, each answering a different question.
- Profitability: is the company making money efficiently?
- Liquidity: can it pay its short-term debts?
- Efficiency: how well does it use its assets?
- Gearing or solvency: how reliant is it on debt?
- Investment: what does it offer shareholders?
A strong analysis usually covers several families, since a company can be profitable yet short of cash, or liquid yet heavily indebted. The full picture comes from reading them together.
How do you calculate profitability ratios?
Three are commonly used. Gross profit margin is gross profit divided by revenue, times one hundred. Net profit margin is net profit divided by revenue, times one hundred. Return on capital employed, ROCE, is operating profit divided by capital employed, times one hundred. For a company with revenue of one million pounds, gross profit of four hundred thousand, then net profit of one hundred thousand, the gross margin is 40 per cent then the net margin is 10 per cent. That gap tells you how much operating cost sits between the two.
How do you calculate liquidity ratios?
Two matter most. The current ratio is current assets divided by current liabilities. The quick ratio, or acid test, is current assets minus inventory, divided by current liabilities. A company with current assets of three hundred thousand pounds then current liabilities of two hundred thousand has a current ratio of 1.5, meaning it holds one pound fifty of short-term assets for every pound of short-term debt. Whether that is healthy depends on the industry, which is why comparison matters.
→ Working through a ratio analysis assignment? A model finance assignment with full working shows how each ratio is calculated then interpreted for a real company, as a reference for your own
How do you calculate gearing and efficiency ratios?
Gearing measures reliance on debt: total debt divided by equity, or debt divided by debt plus equity, times one hundred. A highly geared company carries more risk, since interest must be paid whatever profit it makes. Efficiency ratios show how hard assets work: inventory days show how long stock sits before selling, then receivables days show how long customers take to pay. Rising receivables days can signal a company struggling to collect cash, even while it looks profitable on paper.
How do you interpret ratios?
Interpretation is where the marks live, then it rests on three moves. Compare the ratio to a benchmark, prior year, competitor, or industry average. Explain the trend, is it improving or worsening. Then give context, a reason the number moved. A falling net margin “because rising material costs squeezed profit while prices held” is analysis; simply stating the margin fell is description. Always push from what to why.
What are common ratio analysis mistakes?
Three recur. Calculating ratios without interpreting them, which leaves the assignment half done. Presenting no comparison, so the numbers float without meaning. Then ignoring context, treating a ratio as good or bad in isolation when the industry, or a one-off event, explains it. Avoid all three by pairing every ratio with a comparison then a reason. For the wider report structure that often surrounds a ratio analysis, see our guide to writing a financial analysis report.
How do you compare a company against its industry?
A ratio only becomes meaningful against a benchmark, then the industry average is the most useful one. Find sector averages from industry reports, databases, or a set of comparable listed firms, then place your company’s ratios beside them. A net margin of eight per cent looks weak against a software sector averaging twenty, but strong against a supermarket sector averaging three. Always state the benchmark you compare to, since a ratio in isolation tells the reader nothing about whether it is good.
How do you structure a ratio analysis assignment?
Group your analysis by ratio family rather than listing ratios at random. Cover profitability, then liquidity, then efficiency, then gearing, with a short interpretation after each. Open with a brief introduction to the company then its context, then close with an overall assessment that pulls the families together into a single view of financial health. This structure stops the assignment reading as a disconnected list, then guides the reader to your conclusion.
What are investment ratios?
Investment ratios matter most to shareholders, then often appear in assignments that take an investor’s view. Earnings per share divides profit after tax by the number of shares, showing the profit attributable to each share. The price to earnings ratio divides share price by earnings per share, indicating how much the market pays for each pound of earnings. Dividend yield shows the income return on the share price. These ratios connect a company’s accounts to its value in the market, which is why an investor reads them first.
When you write up ratios, present each with its figure, a comparison, then a sentence of interpretation, rather than a bare table. A short paragraph per ratio family reads far better than a wall of numbers, then it turns calculation into the analysis that earns the marks.
→ Turn numbers into analysis. See pricing for a model ratio analysis to benchmark against, then check your written interpretation with a fast Turnitin report.
Frequently asked questions
What are the five main types of financial ratios?
Profitability, liquidity, efficiency, gearing or solvency, then investment ratios. Each answers a different question about the company, and a strong analysis reads several together rather than in isolation.
How do you calculate the current ratio?
Divide current assets by current liabilities. A company with three hundred thousand pounds of current assets and two hundred thousand of current liabilities has a current ratio of 1.5, meaning one pound fifty of short-term assets per pound of short-term debt.
What is a good profit margin?
It depends entirely on the industry, which is why comparison matters. A supermarket runs on thin margins while a software firm may run on high ones. Always benchmark a margin against competitors or prior years rather than judging it alone.
Why is interpretation important in ratio analysis?
Because the calculation alone earns few marks. The analysis is in explaining what a ratio means, how it compares, then why it changed. Examiners reward the move from the number to its business meaning.




Want more tips & great deals? Get them sent to your inbox
Please enter a valid E-mail
By clicking "Subscribe" you agree to be contacted via e-mail. You can always unsubscribe from the newsletter


